Common Forecast Accuracy Metrics
There is no single “best” forecast accuracy metric.
Different organizations use different measurements depending on their objectives.
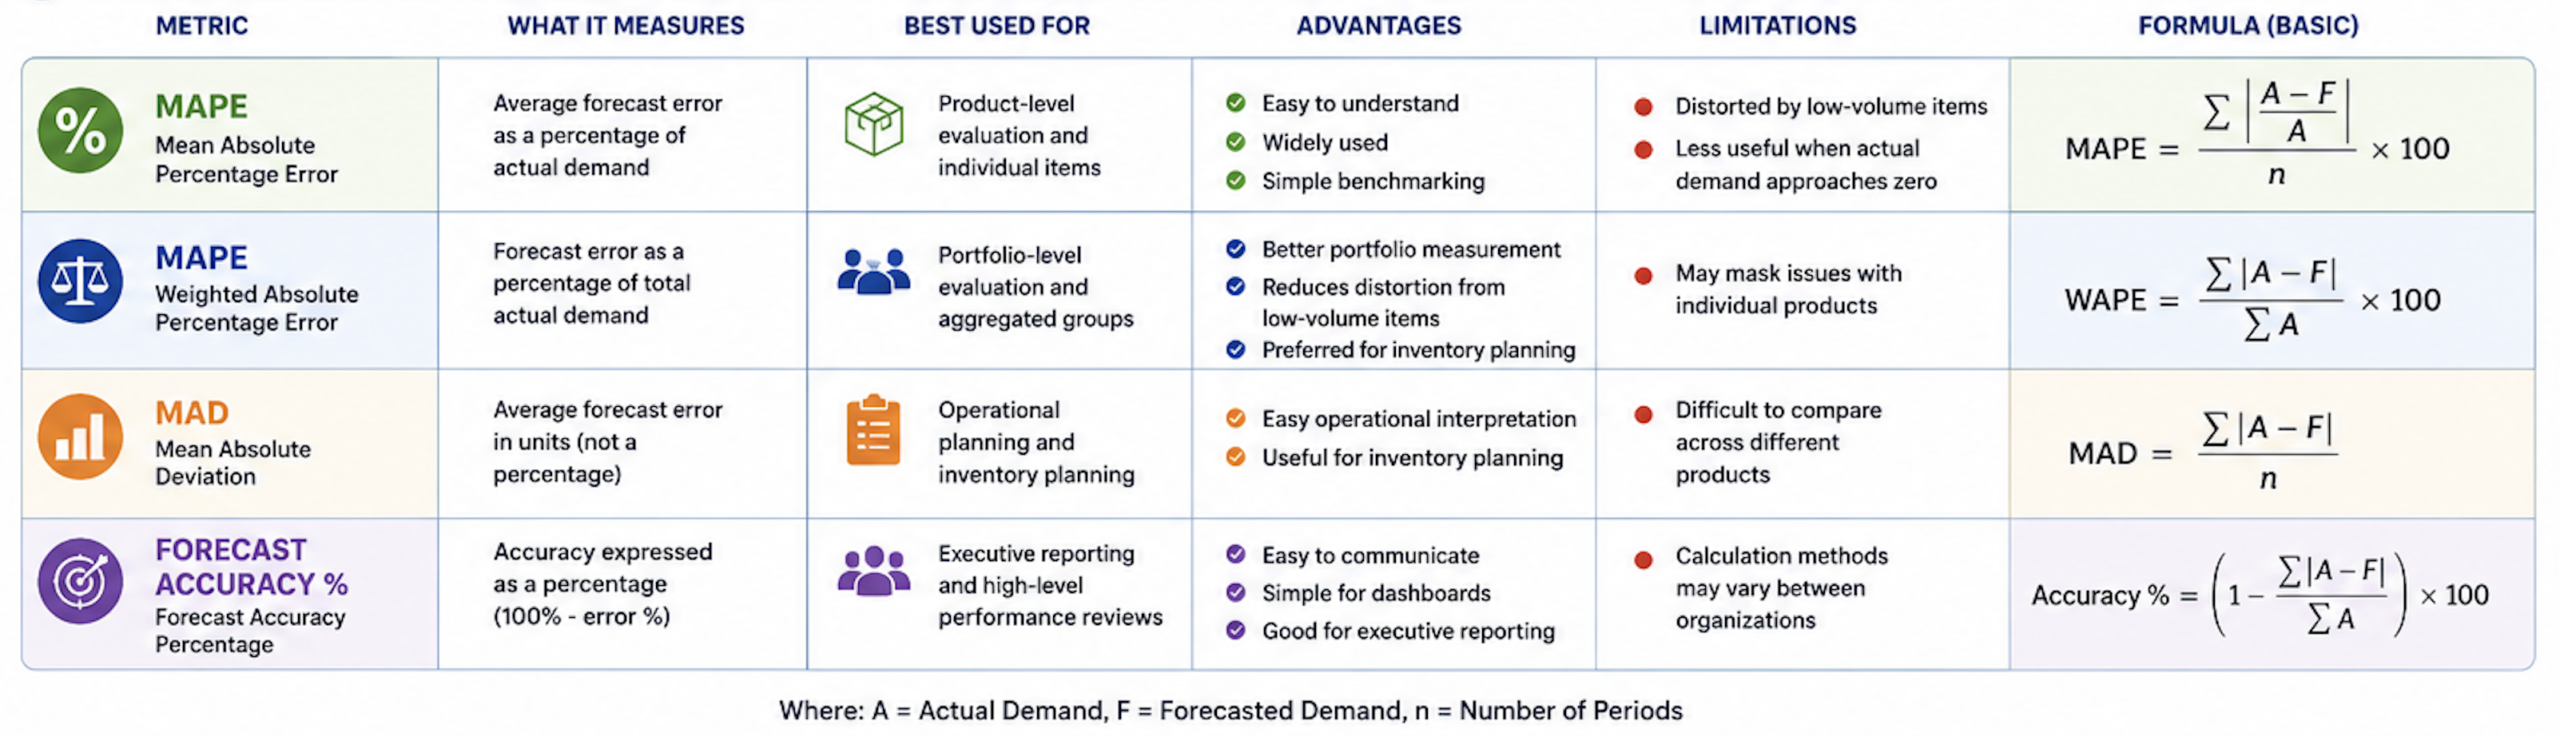
Mean Absolute Percentage Error (MAPE)
MAPE measures forecast error as a percentage of actual demand.
Organizations often use MAPE because it is relatively easy to understand and compare across products.
Advantages:
- Easy to explain
- Widely used
- Simple benchmarking
Limitations:
- Can be distorted by low-volume products
- Less useful when actual demand approaches zero
Weighted Absolute Percentage Error (WAPE)
WAPE measures forecast error across a group of products while accounting for volume differences.
Advantages:
- Better portfolio-level measurement
- Reduces distortion from low-volume items
- Frequently preferred for inventory planning
Limitations:
- May mask issues with individual products
Mean Absolute Deviation (MAD)
MAD measures the average size of forecast errors in units rather than percentages.
Advantages:
- Easy operational interpretation
- Useful for inventory planning
Limitations:
- Difficult to compare across products
Forecast Accuracy Percentage
Some organizations convert forecast error into a forecast accuracy percentage to simplify reporting.
While the exact calculation may vary, the goal is to communicate forecasting performance in an easy-to-understand format.
Which Forecast Accuracy Metric Is Best?
There is no universally perfect forecast accuracy metric.
The most appropriate measurement depends on what the organization is trying to understand and how the information will be used.
Some metrics are easier for executives to interpret. Others provide deeper operational insight for planners and analysts. Many organizations use multiple forecast accuracy measurements because each metric highlights different aspects of forecasting performance.
| Goal |
Metric Often Used |
| Executive reporting |
Forecast Accuracy % |
| Product-level evaluation |
MAPE |
| Portfolio-level evaluation |
WAPE |
| Inventory planning |
MAD or WAPE |
Executive Reporting
Forecast Accuracy Percentage is often preferred for executive reporting because it provides a simple, intuitive way to communicate forecasting performance. Leadership teams can quickly understand whether forecast accuracy is improving or declining over time.
Product-Level Evaluation
MAPE is commonly used when evaluating forecasting performance at the individual product level. Because errors are expressed as percentages, planners can compare forecasting performance across products with different demand volumes.
Portfolio-Level Measurement
WAPE is often preferred when evaluating groups of products or entire product portfolios. Because it accounts for demand volume, it generally provides a more representative view of overall forecasting performance than simple averages.
Inventory Planning
MAD and WAPE are frequently used in inventory planning environments because they help planners understand the magnitude of forecast errors and their potential impact on inventory decisions.
Rather than searching for a single perfect metric, organizations should focus on selecting measurements that support their planning objectives and decision-making requirements.
What Is Considered Good Forecast Accuracy?
One of the most common forecasting questions is:
“What forecast accuracy percentage should we be targeting?”
Unfortunately, there is no universal answer.
Forecast accuracy varies significantly based on factors such as:
- industry
- product mix
- demand variability
- customer behavior
- forecast horizon
- product lifecycle stage
For example, organizations selling highly seasonal products or managing volatile demand patterns may achieve lower forecast accuracy than organizations selling stable, predictable products.
As a general guideline:
| Forecast Accuracy |
Interpretation |
| 90%+ |
Excellent |
| 80-90% |
Strong |
| 70-80% |
Acceptable |
| Below 70% |
Improvement Opportunity |
However, organizations should be careful not to compare themselves blindly against industry benchmarks.
The more important question is whether forecast accuracy is improving over time and whether forecasting performance supports better business decisions.
The goal is not perfect forecasts.
The goal is continuous improvement and reduced planning uncertainty.
Common Causes of Poor Forecast Accuracy
Improving forecast accuracy begins with understanding what causes forecasting errors in the first place.
While every organization faces unique forecasting challenges, several common factors consistently contribute to poor forecasting performance. Identifying and addressing these issues can often produce meaningful improvements in forecast quality.
Poor Data Quality
Forecasting models depend on historical data. When that data is incomplete, inaccurate, inconsistent, or outdated, forecasting performance often suffers.
Common data quality issues include:
- missing sales history
- inaccurate product information
- incorrect lead times
- duplicate records
- inconsistent demand history
Even sophisticated forecasting tools cannot compensate for poor underlying data. Organizations seeking to improve forecast accuracy should regularly review and maintain the quality of the information feeding their planning processes.
Excessive Manual Overrides
Planner judgment is an important part of forecasting, but excessive manual forecast adjustments can introduce additional error and inconsistency.
Many organizations routinely override statistical forecasts based on assumptions, intuition, or anecdotal information. While some overrides are justified, others may reduce forecast quality if they are not supported by objective data.
Organizations should monitor forecast overrides and evaluate whether those changes consistently improve or degrade forecasting performance over time.
Demand Volatility
Some products are simply more difficult to forecast than others.
Rapid changes in customer demand, shifting market conditions, supply chain disruptions, competitive actions, and economic uncertainty can all increase forecast variability.
Highly volatile products often require different forecasting approaches than stable products. Organizations should recognize that not all forecasting challenges can be solved through process improvements alone.
Product Lifecycle Changes
New product introductions, promotional activities, seasonal products, product substitutions, and end-of-life transitions frequently create forecasting challenges.
Historical demand patterns may provide limited guidance when products are entering or exiting the market, causing forecasting models to become less reliable.
Organizations should pay particular attention to lifecycle-driven products and supplement forecasting models with business knowledge when appropriate.
Lack of Cross-Functional Collaboration
Forecasting is rarely a supply chain activity alone.
Sales teams often have visibility into customer opportunities. Marketing teams understand promotional plans. Finance teams maintain revenue expectations. Operations teams understand supply constraints.
When these perspectives remain disconnected, forecast quality often suffers.
Organizations that incorporate cross-functional input into forecasting processes frequently develop more balanced and realistic demand expectations.
How to Improve Forecast Accuracy
Improving forecast accuracy is rarely the result of a single change. Most organizations achieve meaningful improvements by strengthening data quality, refining forecasting processes, improving collaboration, and consistently measuring performance.
The objective is not to eliminate every forecast error.
The objective is to reduce uncertainty and improve planning decisions over time.
Improve Data Quality
Accurate forecasts begin with accurate data.
Organizations should routinely review demand history, product information, lead times, customer data, and planning assumptions to ensure forecasting models are working from reliable information.
Even small data quality improvements can have a meaningful impact on forecasting performance. Many forecasting problems that appear to be model issues are ultimately data issues.
Measure Accuracy Consistently
Forecast accuracy should be monitored regularly rather than only during annual reviews or major planning cycles.
Consistent measurement helps organizations identify trends, evaluate process changes, and understand whether forecasting performance is improving over time.
Organizations should establish clear forecast accuracy KPIs and review them as part of ongoing planning processes.
Review Forecast Overrides
Forecast overrides should be treated as measurable decisions rather than routine activities.
Organizations often benefit from tracking:
- how often overrides occur
- who is making overrides
- which products are affected
- whether overrides improve forecast performance
This visibility helps planners distinguish between overrides that add value and overrides that introduce unnecessary bias or error.
Use Statistical Forecasting
Statistical forecasting provides an objective baseline that can help reduce human bias and improve forecasting consistency.
While no forecasting model is perfect, statistical forecasting helps organizations identify trends, seasonality, and demand patterns that may not be obvious through manual forecasting alone.
The most effective forecasting processes often combine statistical forecasting with informed business judgment rather than relying exclusively on either approach.
Improve Collaboration
Demand forecasting improves when multiple perspectives are incorporated into the planning process.
Sales, marketing, operations, finance, purchasing, and supply chain teams often possess information that may not be visible within historical demand data alone.
Cross-functional forecasting processes help organizations incorporate these insights while maintaining alignment around a shared demand plan.
Organizations that improve collaboration often achieve not only stronger forecast accuracy, but also better organizational alignment and more effective decision-making.
Frequently Asked Questions
What is forecast accuracy?
Forecast accuracy measures how closely forecasted demand matches actual demand over a specific period. It is one of the most commonly used forecasting KPIs because it helps organizations evaluate forecasting performance objectively.
By measuring forecast accuracy, businesses can identify forecasting strengths and weaknesses, improve planning processes, and make better inventory, purchasing, production, and financial decisions. While no forecast will ever be perfectly accurate, organizations that consistently measure forecast accuracy are often better positioned to reduce uncertainty and improve planning outcomes.
What is a good forecast accuracy percentage?
There is no universal benchmark that applies to every organization.
Forecast accuracy depends on factors such as product mix, demand variability, forecast horizon, customer behavior, and industry conditions. A company forecasting highly seasonal products may face different challenges than one forecasting stable demand patterns.
As a general guideline, forecast accuracy above 80% is often considered strong, while accuracy above 90% may be considered excellent. However, organizations should focus less on achieving a specific number and more on continuously improving forecasting performance over time.
What is the difference between forecast accuracy and forecast bias?
Forecast accuracy measures the size of forecast errors. It helps answer questions such as:
- How close were our forecasts to actual demand?
- How large were our forecasting errors?
Forecast bias measures whether forecast errors consistently lean in one direction. It helps answer questions such as:
- Are we consistently overforecasting?
- Are we consistently underforecasting?
An organization may have relatively strong forecast accuracy while still exhibiting significant forecast bias. For this reason, many organizations monitor both metrics together as part of a comprehensive forecasting performance program.
Which forecast accuracy metric is best?
There is no single forecast accuracy metric that is ideal for every situation.
MAPE is commonly used for product-level forecasting analysis because it expresses errors as percentages that are easy to understand. WAPE is often preferred for portfolio-level reporting because it accounts for demand volume and reduces distortion from low-volume products. MAD is frequently used in inventory planning because it measures forecast error in units rather than percentages.
Many organizations use multiple forecast accuracy metrics because each provides different insights into forecasting performance. The best metric is ultimately the one that supports the decisions your organization needs to make.
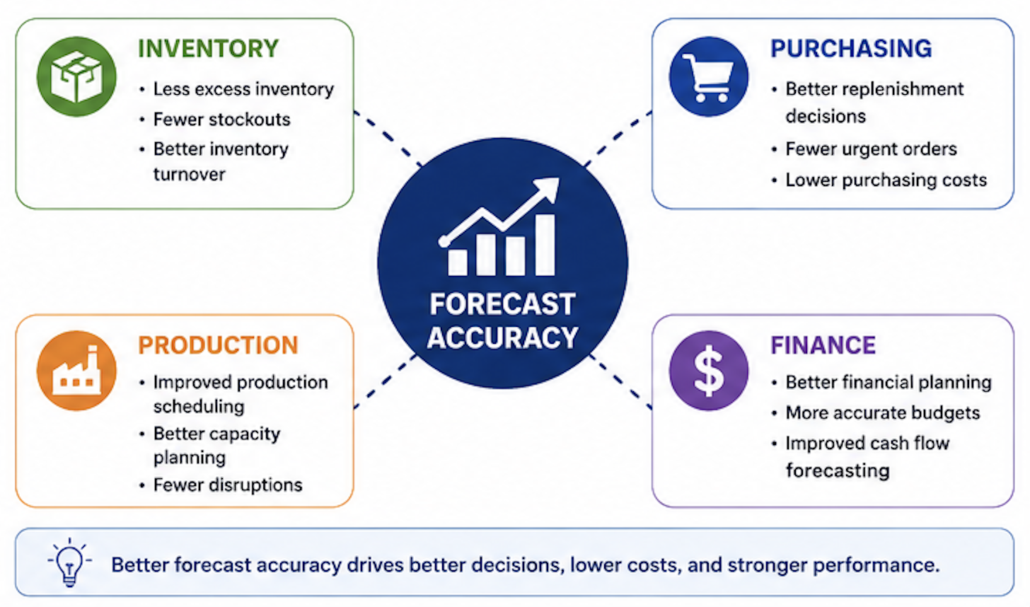
Why is forecast accuracy important?
Forecast accuracy influences nearly every aspect of planning and supply chain performance.
More accurate forecasts help organizations make better inventory decisions, improve service levels, reduce stockouts, lower excess inventory, and support more effective purchasing and production planning. Forecast accuracy also impacts financial planning, revenue forecasting, cash flow management, and working capital performance.
Because forecasts serve as the foundation for so many business decisions, even modest improvements in forecast accuracy can create meaningful operational and financial benefits across the organization.
Final Thoughts
Forecast accuracy is far more than a forecasting metric.
It is a measure of how effectively an organization understands future demand and translates that understanding into better business decisions.
Accurate forecasts help support inventory planning, purchasing, production scheduling, service-level management, and financial planning. They provide organizations with greater visibility into future demand and help reduce the uncertainty that often drives excess inventory, stockouts, and operational inefficiencies.
At the same time, organizations should remember that forecast accuracy is not about achieving perfect forecasts. Every forecast contains some degree of error. The objective is to continuously improve forecasting performance and create a planning process that supports better decision-making over time.
Organizations that consistently measure forecast accuracy, monitor forecast bias, improve data quality, and strengthen collaboration across teams are often better positioned to improve inventory performance, increase service levels, and make more confident planning decisions.
The goal is not perfect forecasts.
The goal is better business outcomes.
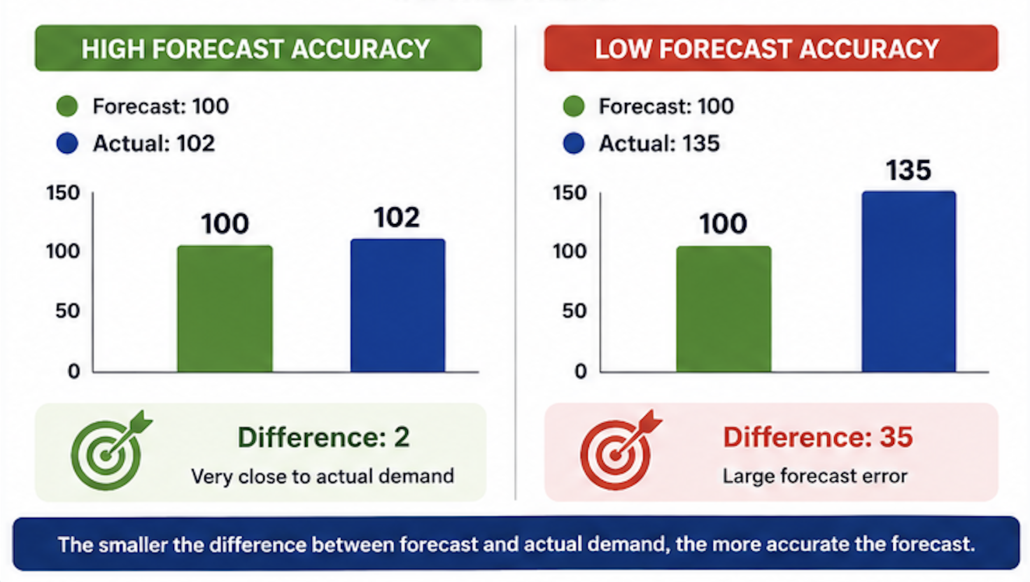 Because forecasted demand is relatively close to actual demand in each period, forecast accuracy would generally be considered strong.